Embedded, self-service analytics on top of Postgres data
This article shows how to embed self-service analytics on top of your Postgres data with the GoodData.CN cloud-native analytics and the GoodData.UI data visualization toolkit.
The GoodData.CN includes tools and frameworks:
- Powerful data analytics with semantic model and measures layer
- API first approach. Convenient APIs for a seamless fit to your frontend and backend.
- Flexible embedding with first-class support for React, Vue, Angular, and other popular Javascript frameworks.
- Easy to use, visual, self-service analytics tools (dashboards, data visualizations) embeddable to SaaS applications.
- Automated distribution of the analytics to many tenants (external and internal organizations) and integration with your CI/CD pipeline.
- Flexible deployment to many public and private cloud infrastructures. Availability of fully hosted option.
I believe that GoodData is the fastest, and the cheapest way how to implement beautiful, and easy-to-use self-service analytics in your application. Moreover, GoodData provides very competitive pricing with generous free options.
Here is a short overview video in case you want to check it out GoodData before you start.
Install the Docker Desktop
The GoodData.CN Community Edition is packaged as a Docker image. You’ll need to install the Docker Desktop. Once you have it installed, you’ll need to double-check that the GoodData.CN can allocate at least 3GB of RAM.

Pull the GoodData.CN image
The next step is to pull the GoodData.CN image from the Docker Hub by invoking this command-line statement:
docker pull gooddata/gooddata-cn-ceRun the GoodData.CN
The GoodData.CN can be executed via this command-line statement:
docker run -t -i -p 3000:3000 gooddata/gooddata-cn-ceYoull’ need to write yes to the console to express your agreement with the GoodData.CN license agreement.
Once you see this text in your console
/============= All services of GoodData.CN are ready ==============\ | | | Navigate your browser to http://localhost:3000/ | | |
| You can log in as user demo@example.com with password demo123 |
| To access API, use Bearer token YWRtaW46Ym9vdHN0cmFwOmFkbWluMTIz | | |
\============= All services of GoodData.CN are ready ==============/
start your browser and open the http://localhost:3000/. You can authenticate with demo@example.com / demo123 credentials.
Install and configure the Postman
The GoodData.CN is API first. You can use its web UI for configuring it or invoking any action. However, in this article, I’ll use APIs wherever it makes sense. I’ll use Postman, curl, and the GoodData.CN API console for invoking the APIs.
curl http://localhost:3000/api/entities/workspaces -H “Authorization: Bearer YWRtaW46Ym9vdHN0cmFwOmFkbWluMTIz” -H “Content-Type: application/vnd.gooddata.api+json” -H “Accept: application/vnd.gooddata.api+json” -X POST \
-d ‘{
“data”: {
“id”: “dvdrental”,
“type”: “workspace”,
“attributes”: {
“name”: “DVD Rental”
}
}
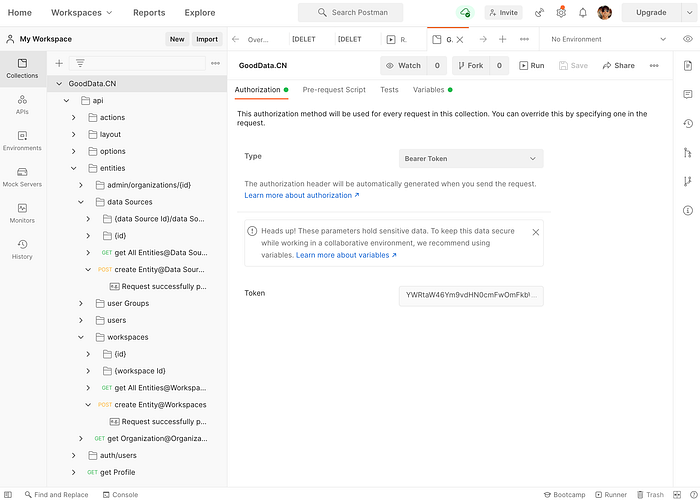
}‘Now we’ll configure the Postman. You need to import the GoodData.CN API OpenApi schema from this URL
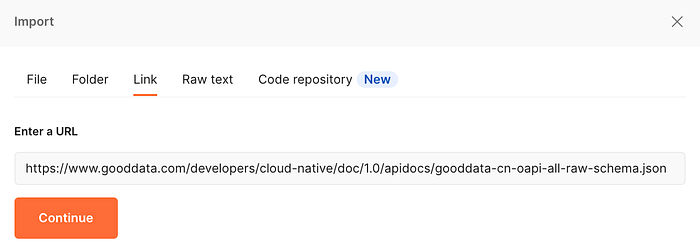
and set up the bearer authentication token YWRtaW46Ym9vdHN0cmFwOmFkbWluMTIz .
Create a workspace
Workspace is a container that contains analytical objects like dashboards, data visualizations, measures, etc. Workspace is used for delivering your analytics to multiple tenants (customers, partners, etc.). You can learn more about workspaces here.
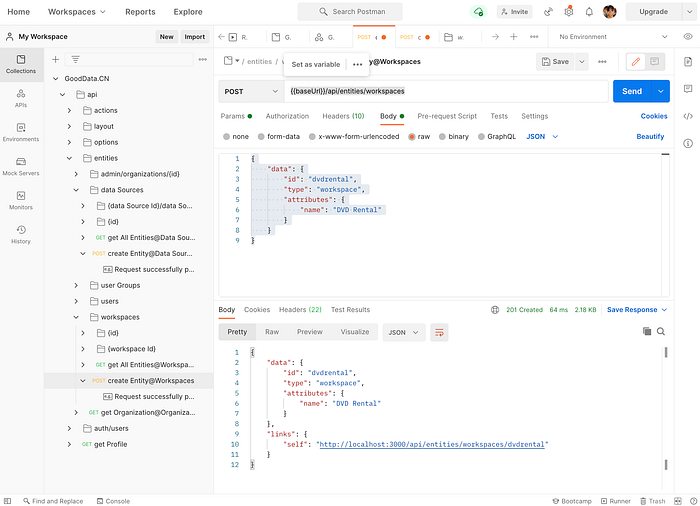
You create workspace by POSTing this payload to http://localhost:3000/api/entities/workspaces
curl http://localhost:3000/api/entities/workspaces -H “Authorization: Bearer YWRtaW46Ym9vdHN0cmFwOmFkbWluMTIz” -H “Content-Type: application/vnd.gooddata.api+json” -H “Accept: application/vnd.gooddata.api+json” -X POST \
-d '{
   “data”: {
     “id”: “dvdrental”,
     “type”: “workspace”,
     “attributes”: {
       “name”: “DVD Rental”
     }
   }
}'
I’ve invoked the same API from Postman.
Connecting the Postgres database
The next step is to connect the Postgres database. I’m running Postgres on the same machine as the Docker image and use the host.docker.internal hostname for referencing the Postgres on my local machine.
For purposes of this demo, I’ve loaded the DVD rental sample database data to my Postgres database. I’ve also created alternative scripts for creating the database here.
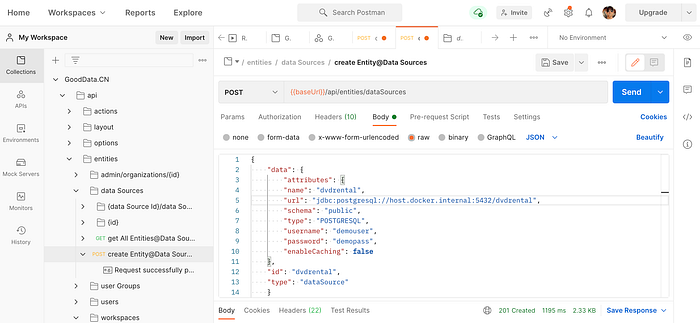
I’ve used the GoodData.CN’s API console for POSTing this payload to http://localhost:3000/api/entities/dataSources to connect to the local DVD rental.
curl http://localhost:3000/api/entities/dataSources -H “Authorization: Bearer YWRtaW46Ym9vdHN0cmFwOmFkbWluMTIz” -H “Content-Type: application/vnd.gooddata.api+json” -H “Accept: application/vnd.gooddata.api+json” -X POST \
-d '{
   “data”: {
     “attributes”: {
       “name”: “dvdrental”,
       “url”: “jdbc:postgresql://host.docker.internal:5432/dvdrental”,
       “schema”: “public”,
       “type”: “POSTGRESQL”,
       “username”: “demouser”,
       “password”: “demopass”,
       “enableCaching”: false
     },
     “id”: “dvdrental”,
     “type”: “dataSource”
   }
}'
Here is the same POST from the Postman
Creating the analytical model
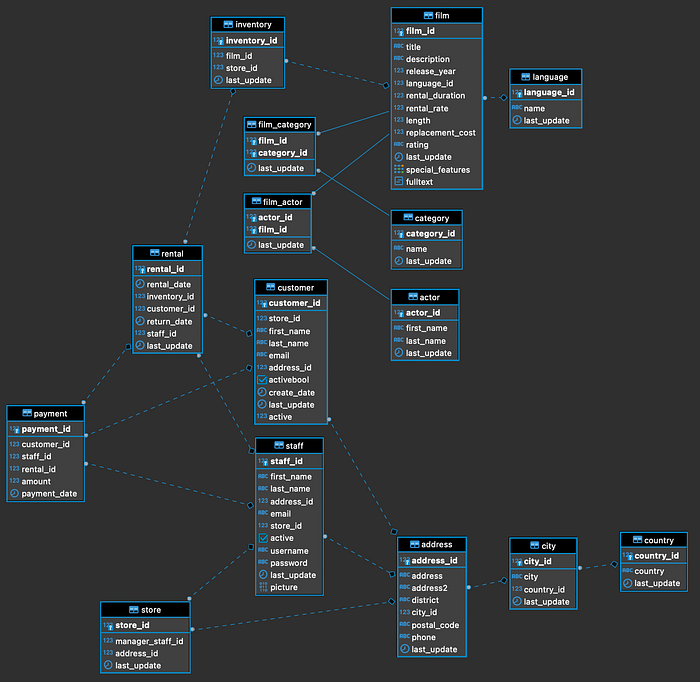
The analytical model (aka semantic or logical data model) brings the data to the analytical tools. The model also consistently defines the relationships, and calculations for all analytics users and encapsulates the analytics from underlying database schema changes. Let's create a model for our DVD rental database schema.
The DVD rental database schema is optimized for a transactional database. Analytical databases usually use a star or snowflake schema.
Building a complete start schema on top of the DVD rental database would be overkill, so for purposes of this article, I’ll only create few helper views that join multiple existing tables together.
I’ll start with analyzing the rental (sales) process first. For this, I’ll create two helper views in our DVD database to achieve the star-schema-like structure. I’ve used the DBeaver for executing SQL statements in the Postgres database.
create or replace view a_dvd_rental as
 select r.rental_id, r.rental_date, r.return_date,
   r.customer_id, sf.store_id, i.film_id, p.amount
     from rental r
       join staff sf on sf.staff_id = r.staff_id
       join store s on s.store_id = sf.store_id
       join inventory i on i.inventory_id = r.inventory_id
       join film f on f.film_id = i.film_id
       join payment p on p.rental_id = r.rental_id;

create or replace view a_dvd_store as
 select s.store_id, a.city_id, c.country_id
     from store s
       join address a on a.address_id = s.address_id
       join city c on c.city_id = a.city_id;
The rest of the analytical model creation happens in the GoodData.CN UI that you can access at http://localhost:3000 (username: demo@example.com, password: demo123). From this page, open the DVD Rental workspace that we’ve previously created with the API call.
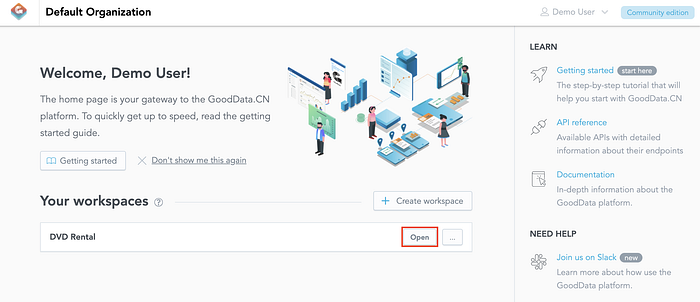
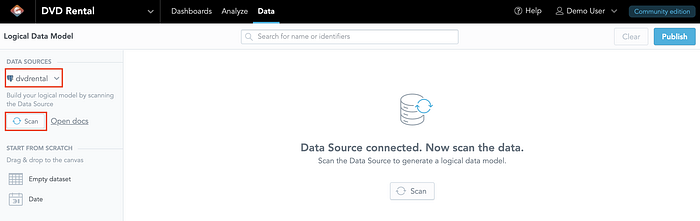
Once you open the workspace, click on the Data menu to get into the LDM modeler where you create the analytics model.

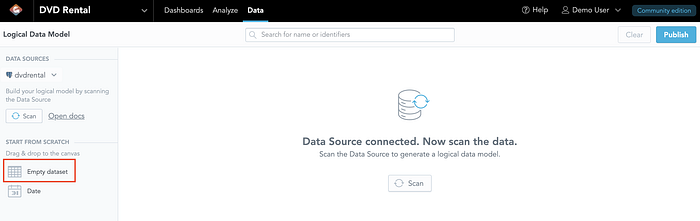
You’ll start creating the model with the Rental dataset. First, please make sure that you see the dvdrental database connection that we’ve created via the API call above. Then click the Scan button.
The image below shows how you want to configure the initial scan that will fetch the data table structure from the Postgres dvdrental database.
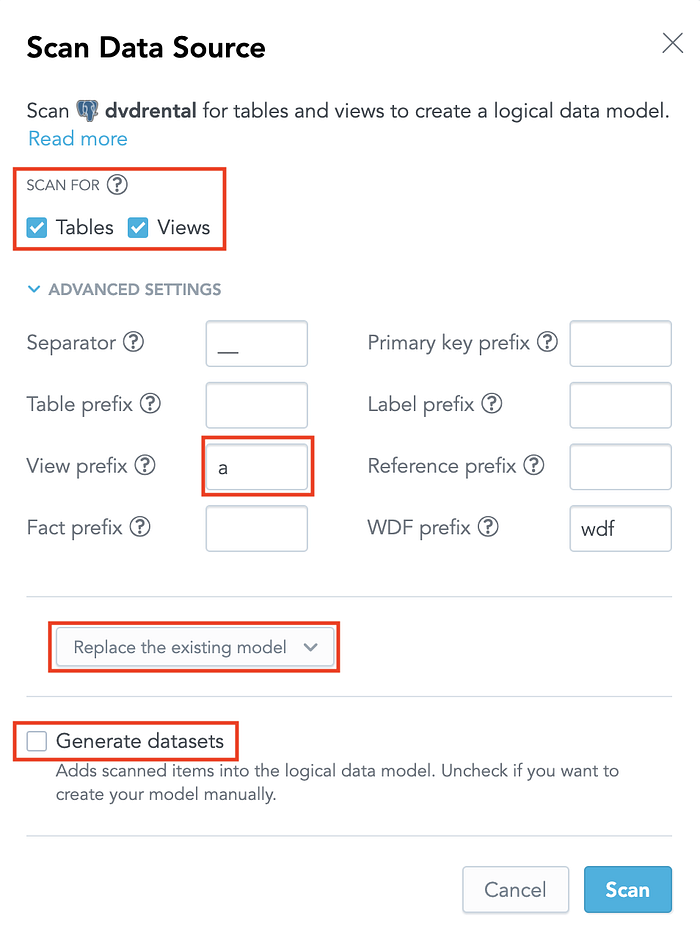
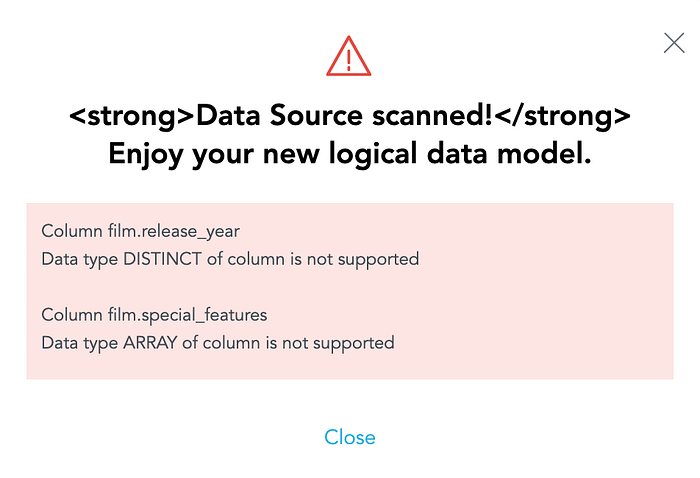
The scan may show some warnings regarding unsupported data types. You may safely ignore them.
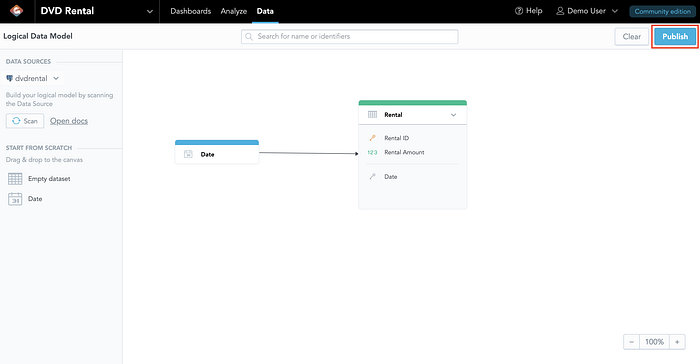
Once the scan finishes, you can create the Rental dataset by dragging the Empty dataset from the left bar to the canvas.
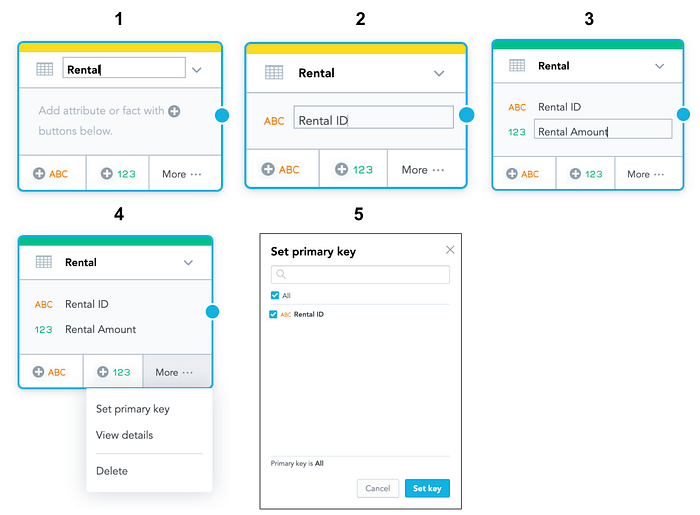
Name the new dataset Rental and create a primary key field named Rental ID and a numeric field named Rental Amount.
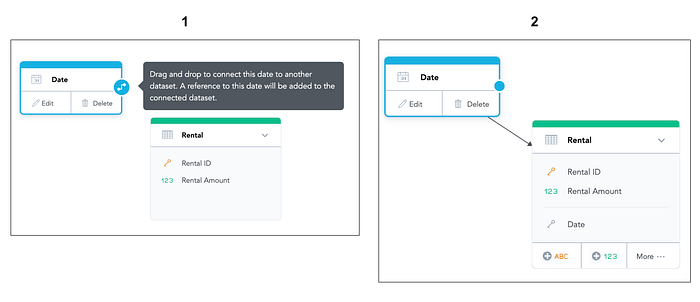
Then drag the Date dataset from the LDM modeler’s left bar to the canvas, name the new dataset Date and connect it to the Rental dataset by dragging the blue dot on the Date dataset.
The next step is to map your new data model to the underlying Postgres database tables. Then map the Rental created dataset to the a__dvd_rental database view that you’ve created earlier. Map the dataset’s fields to the view’s columns.
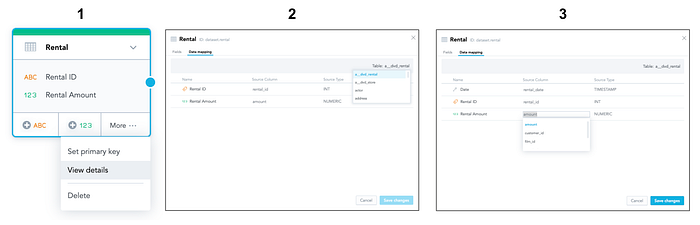
Then publish the data model.
Data Analysis
Once the data model is published, go to the Analyze tab and create your first data insight.
Dashboard
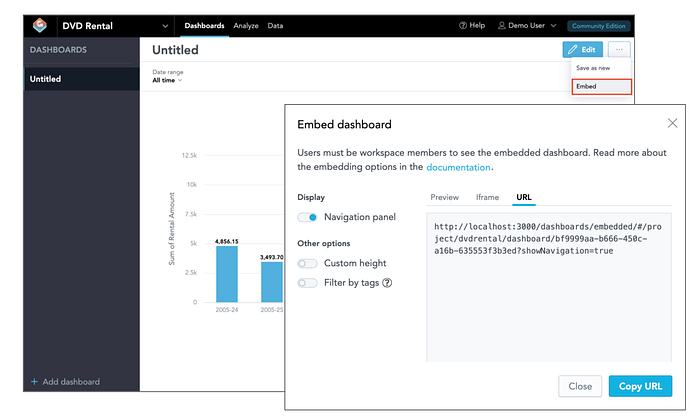
Then you can place the new insight on a dashboard.
You can embed your new dashboard to your application or a web page as IFRAME. Later I’ll show you how to embed analytics into your app as a React component.
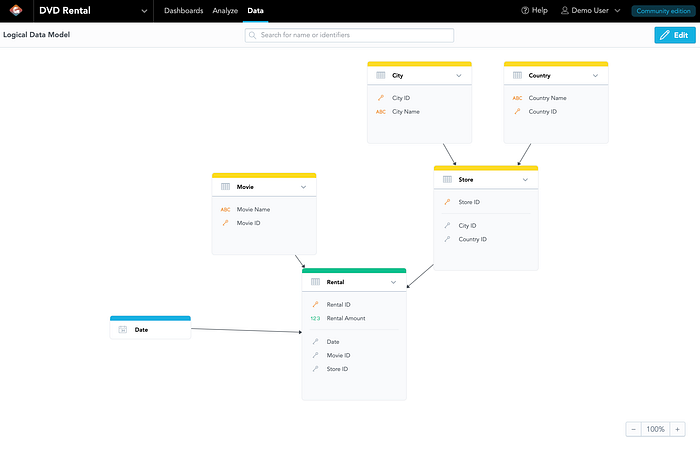
Extending the data model
Now you can go back to the Data tab and extend the data model with additional datasets.
APIs
You can try my extended model by POSTing its definition to the GoodData.CN API. This time I’ll use the GoodData.CN API console (at http://localhost:3000/apidocs/) instead of the Postman.
The extended data model definition (JSON file) is available in the dvdrental Github repository alongside other useful files.
Navigate to the data model PUT API (at http://localhost:3000/apidocs/?urls.primaryName=Metadata#/declarative-layout-controller/setLogicalModel) and post the content copied from the JSON file.
Now you have many more data for your analysis. Go back to the Analytical Designer, create couple more insights, and add them to your dashboard.
Create measures
Now you are going to create few calculated measures that we are going to use in the following examples. You’ll use simple curl command-line statements.
First, you create the Rental Amount measure:
curl http://localhost:3000/api/entities/workspaces/dvdrental/metrics -H "Content-Type: application/vnd.gooddata.api+json" -H "Accept: application/vnd.gooddata.api+json" -H "Authorization: Bearer YWRtaW46Ym9vdHN0cmFwOmFkbWluMTIz" -X POST \
-d '{
 "data": {
  "attributes": {
   "content": {
    "maql": "SELECT SUM({fact/fact.rental.rentalamount})",
    "format": "#,##0.0"
   },
   "title": "Rental Amount (SUM)",
   "description": "Rental amount."
  },
  "id": "rentalAmount",
  "type": "metric"
 }
}'
Then you create the Rental Count measure:
curl http://localhost:3000/api/entities/workspaces/dvdrental/metrics -H "Content-Type: application/vnd.gooddata.api+json" -H "Accept: application/vnd.gooddata.api+json" -H "Authorization: Bearer YWRtaW46Ym9vdHN0cmFwOmFkbWluMTIz" -X POST \
-d '{
 "data": {
  "attributes": {
   "content": {
    "maql": "SELECT COUNT({attribute/attr.rental.rentalid})",
    "format": "#,##0.0"
   },
   "title": "Rental Count",
   "description": "Rental count."
  },
  "id": "rentalCount",
  "type": "metric"
 }
}'
Develop a React analytical app
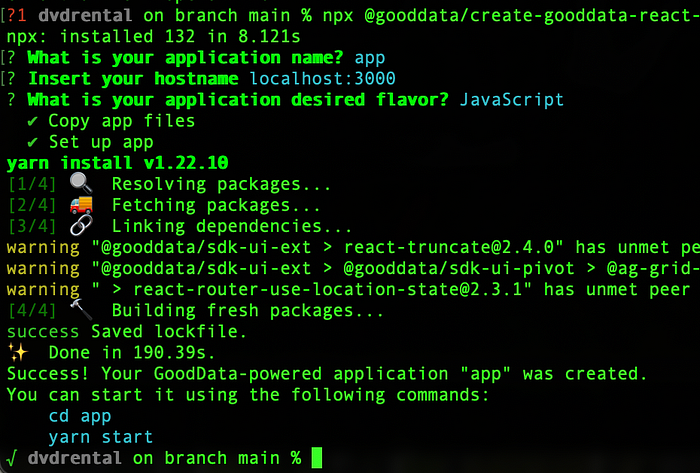
Now you’ll create a simple React application using the GoodData.UI Accelerator Toolkit. Open your terminal and type the following command
npx @gooddata/create-gooddata-react-app --backend tigerto generate a skeleton of your React app. Name your application dvdrental and use the hostname localhost:3000.
NOTE: Node 16 didn’t work for me at the time of writing this article. I had to downgrade to node 14.
Go to the generated directory and execute the app via yarn start. You have to also export the GoodData.CN authentication token environment variable before you start.
export REACT_APP_DEV_TIGER_API_TOKEN="YWRtaW46Ym9vdHN0cmFwOmFkbWluMTIz"
cd app
yarn start
Your browser should open this page.
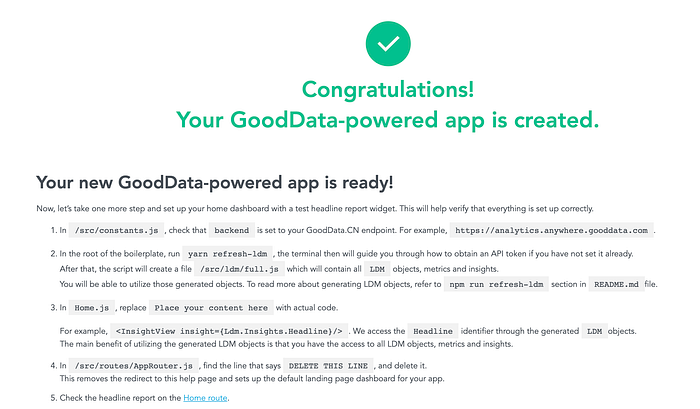
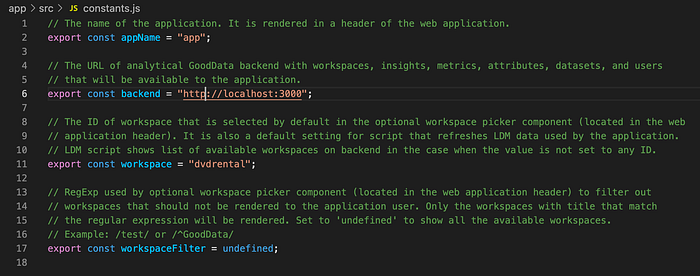
Follow the directions on the main page and edit the src/constants.js . Use the hostname http://localhost:3000 and workspace dvdrental .
Your next step is to generate friendly JavaScript identifiers for the data model objects that you’ll reference from your future code. Open another terminal window and run this command
export TIGER_API_TOKEN="YWRtaW46Ym9vdHN0cmFwOmFkbWluMTIz"
yarn refresh-ldm
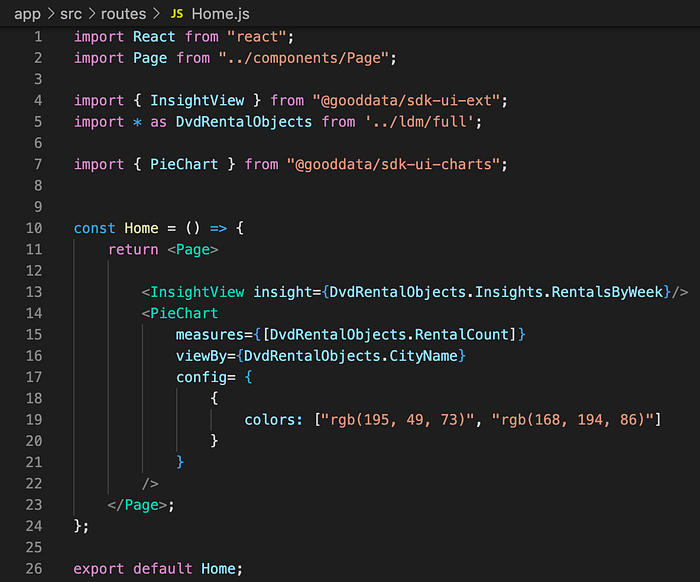
Once you generate JavaScript constants with friendly names for the data model objects and other metadata, you can edit the src/routes/Home.js file to code your first insight.
First, add two import statements at the top of the file
import { InsightView } from "@gooddata/sdk-ui-ext";
import * as DvdRentalObjects from '../ldm/full';
and then edit the return value from the Home function to return the InsightView component that points to the insight that we’ve previously created.
const Home = () => {
 return
  <Page>
   <InsightView insight={DvdRentalObjects.Insights.RentalsByWeek}/>
  </Page>;
};
Then return to the browser, switch to the Home tab and you should see the embedded bar chart.
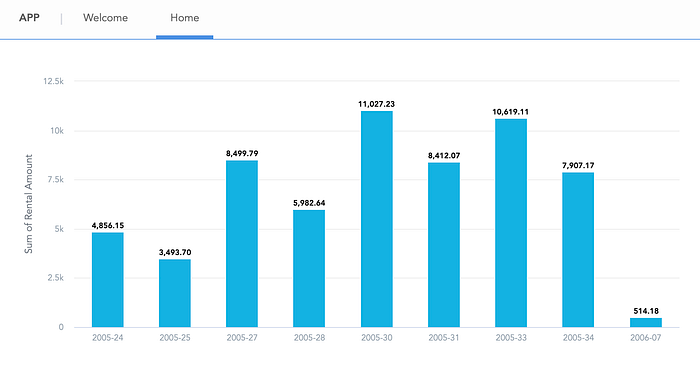
The embedded insight is going to change if you change its definition in the Analytical Designer.
You can also hard-code insights programmatically. Here is an example. Import PieChart visualization
import { PieChart } from "@gooddata/sdk-ui-charts";and add the pie chart block behind the InsightView line
<PieChart
 measures={[DvdRentalObjects.RentalCount]}
 viewBy={DvdRentalObjects.CityName}
 config= {
  {
   colors: ["rgb(195, 49, 73)", "rgb(168, 194, 86)"]
  }
 }
/>
Refresh the browser and review the new pie chart.

Your last step is to embed the dashboard that we’ve created earlier. Again, you need to import the DashboarView component.
import { DashboardView } from "@gooddata/sdk-ui-ext";and add the DashboarView to the code
<DashboardView dashboard={DvdRentalObjects.Dashboards.Untitled_5}/>Please double-check the generated src/ldm/full.js file for the name of the dashboard (my dashboard name is Untitled_5 ).
Creating workspaces for multiple tenants
The simple analytical application that you’ve just created can be rolled out to many different tenants. I’ll show, how you can roll out your solution to two DVD rental stores in two cities that the DVD rental database contains (Leithbridge, and Woodbridge).
Both stores are going to use their private workspaces. You can inherit them from the workspace that you’ve just created by using relationship tag during a tenant’s workspace creation. Let's create the Leightbridge workspace first:
curl http://localhost:3000/api/entities/workspaces -H “Authorization: Bearer YWRtaW46Ym9vdHN0cmFwOmFkbWluMTIz” -H “Content-Type: application/vnd.gooddata.api+json” -H “Accept: application/vnd.gooddata.api+json” -X POST \
-d '{
  "data": {
    "id": "leightbridge",
    "type": "workspace",
    "attributes": {
      "name": "Leightbridge"
    },
    "relationships": {
      "parent": {
        "data": {
          "id": "dvdrental",
          "type": "workspace"
        }
      }
    }
  }
}'
and then the Woodbridge workspace
curl http://localhost:3000/api/entities/workspaces -H “Authorization: Bearer YWRtaW46Ym9vdHN0cmFwOmFkbWluMTIz” -H “Content-Type: application/vnd.gooddata.api+json” -H “Accept: application/vnd.gooddata.api+json” -X POST \
-d '{
  "data": {
    "id": "woodbridge",
    "type": "workspace",
    "attributes": {
      "name": "Woodbridge"
    },
    "relationships": {
      "parent": {
        "data": {
          "id": "dvdrental",
          "type": "workspace"
        }
      }
    }
  }
}'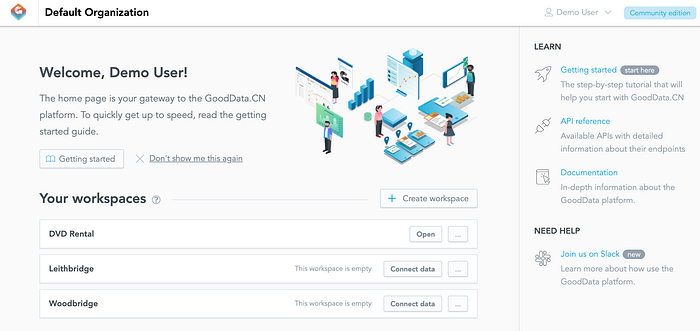
You can check out the main GoodData.CN page at http://localhost:3000 to see the new workspaces. If you open them, you’ll find out that they contain data model, insights, and dashboards inherited from your original dvdrental workspace.
Setting multitenancy filters
The multitenancy filters ensure that tenants see their data in their insights. These filters are appended to every query that GoodData.CN sends to the underlying database. You can set up the multitenancy filters via this API call.
curl http://localhost:3000/api/layout/workspaceDataFilters -H “Authorization: Bearer YWRtaW46Ym9vdHN0cmFwOmFkbWluMTIz” -H “Content-Type: application/json” -H “Accept: application/vnd.gooddata.api+json” -X PUT \
-d '{
"workspaceDataFilters": [
{
"id": "store_id",
"title": "Store ID filter",
"columnName": "store_id",
"dataSourceId": "dvdrental",
"workspace": {
"id": "dvdrental",
"type": "workspace"
},
"workspaceDataFilterSettings": [
{
"id": "leightbridge",
"title": "Leightbridge store",
"filterValues": ["1"],
"workspace": {
"id": "leightbridge",
"type": "workspace"
}
},
{
"id": "woodbridge",
"title": "Woodbridge store",
"filterValues": ["2"],
"workspace": {
"id": "woodbridge",
"type": "workspace"
}
}
]
}
]
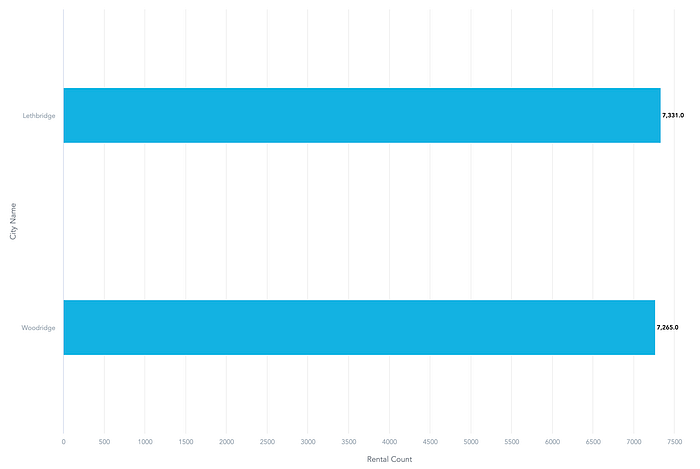
}'After you set up the filters, go to the parent dvdrental workspace and create a Rental Amount by City insight in the Analytical Designer.
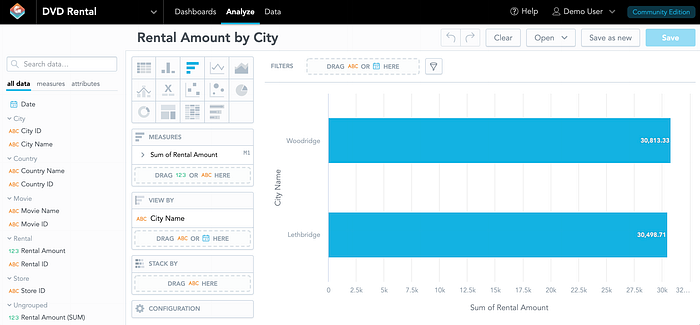
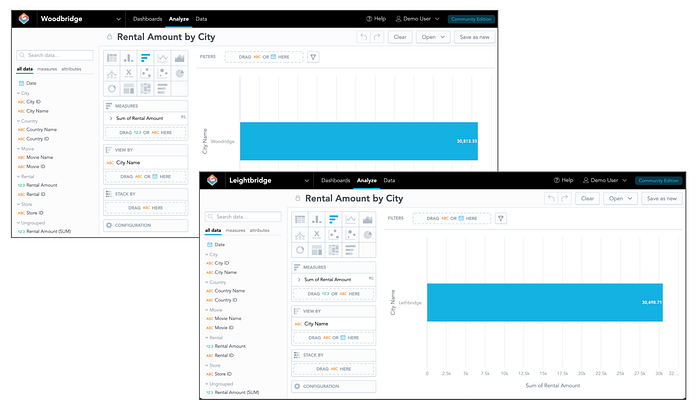
The insight shows data for both cities as no multitenancy data filters are applied to the parent workspace. The insight is inherited so it is immediately available in both tenant’s workspaces. If you open it in each workspace, the data are shown only for one city because the multitenancy filters are enforced.
Summary
You’ve just implemented a complete, nice, and functional analytical app on top of the popular Postgres sample database and distributed it to two tenants.
All in roughly 30 minutes! With a little more investment, you can do the same on top of your data. The GoodData.CN supports other databases like Snowflake or Redshift and GoodData is working on many others.
You obviously need to do some hardening to roll this solution out to production (e.g. setting up single-sign-on with OAuth or CORS, etc.). All these production aspects are easy to handle with the GoodData platform. For that and also for learning more details you might find useful the following documentation, community, and education links:
- GoodData.CN documentation
- GoodData.UI documentation
- Ask questions in the GoodData community Slack channel
- Search GoodData community forum
- Learn more in GoodData University
- Learn more about the free GoodData hosted SaaS platform
Please, let me know, how you liked this article, whether you had any difficulties in certain sections, or have an idea how to make it better.
Thank you for reading!

